Essay
Use the two graphs below to explain the relationship between total product and marginal product. 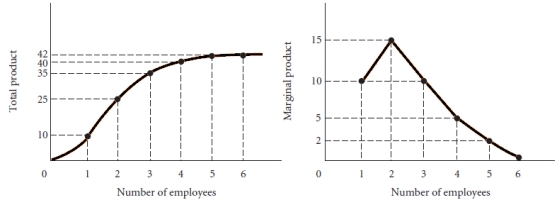
Correct Answer:

Verified
A production function is a numerical rep...View Answer
Unlock this answer now
Get Access to more Verified Answers free of charge
Correct Answer:
Verified
A production function is a numerical rep...
View Answer
Unlock this answer now
Get Access to more Verified Answers free of charge
Related Questions
Q52: Barney's Beds currently hires 14 workers. The
Q53: As a manager of a dry-cleaning establishment,
Q54: Using an example, explain the difference between
Q55: Why might certain industries have a long
Q56: What is the relationship between the marginal
Q58: Define the normal rate of return. If
Q60: How does a firm measure its profit?
Q61: Using the table below explain why the
Q62: Assume that a company is producing at
Q190: What is a firm?