Essay
Using the graph below draw a marginal cost curve that would likely be the result. Use the output level of 200 as a reference point and explain why you drew it the way you did. 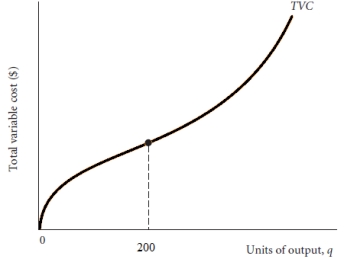
Correct Answer:

Verified
The marginal cost curve is likely to loo...View Answer
Unlock this answer now
Get Access to more Verified Answers free of charge
Correct Answer:
Verified
The marginal cost curve is likely to loo...
View Answer
Unlock this answer now
Get Access to more Verified Answers free of charge
Related Questions
Q4: Laura's Cookie Company faces the following cost
Q5: What is the relationship between total variable
Q6: What is meant by marginal revenue?
Q7: The equation for the firm's total variable
Q8: What is the shape of the total
Q10: What is meant by variable cost? What
Q11: White Paper Company faces the following cost
Q12: Explain how it might be possible for
Q13: If a firm shuts down in the
Q14: What is meant by spreading overhead?