Essay
The figures below represent the demand for a public good for two consumers, Tom and Jerry. Assuming that these are the only two buyers, draw a graph showing the market demand curve for this public good. 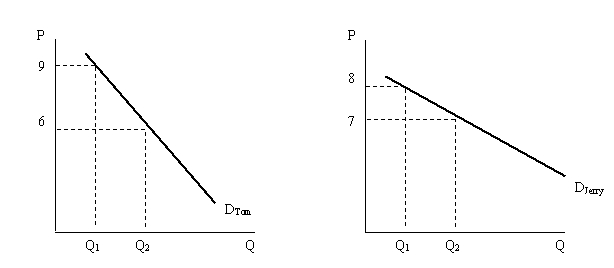
Correct Answer:

Verified
To arrive at the market demand...View Answer
Unlock this answer now
Get Access to more Verified Answers free of charge
Correct Answer:
Verified
To arrive at the market demand...
View Answer
Unlock this answer now
Get Access to more Verified Answers free of charge
Related Questions
Q35: List four sources of market failure.
Q36: Why are public goods a source of
Q37: What is market failure?
Q38: Why would a firm continue to pollute
Q39: What is marginal social cost?
Q41: Explain why cable television is not a
Q42: What does it mean for a good
Q43: Economists often refer to taxes, subsidies, legal
Q44: In what way can liability rules lead
Q45: What three conditions must be satisfied in