Multiple Choice
The figure below shows the isocost lines and the isoquant map for a firm producing golf tees. 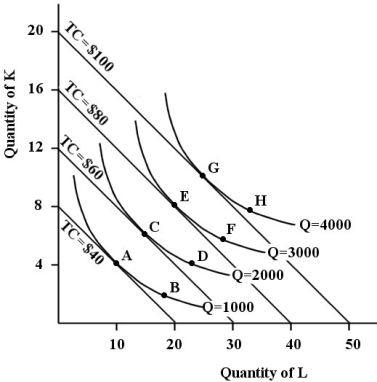 FIGURE 8-6
-Refer to Figure 8-6. As this firm is increasing its production of golf tees, it is experiencingreturns to scale.
A) not determinable from the information provided
B) constant
C) decreasing
D) diminishing
E) increasing
Correct Answer:

Verified
Correct Answer:
Verified
Q5: If factor prices decrease,<br>A) there will be
Q15: Which of the following paired concepts are
Q16: By expressing the cost-minimizing condition as MPK/MPL
Q23: Which of the following conditions indicate cost
Q25: If there is an improvement in the
Q53: In the long run, the law of
Q61: "The bigger the volume, the lower the
Q67: Canada has a much lower population density
Q90: Increasing returns to scale for a firm
Q99: Consider a firm that uses only labour