Multiple Choice
The figure below shows a family of cost curves for a firm. The subscripts 1, 2, and 3 for the SRATC curves refer to different plant sizes. 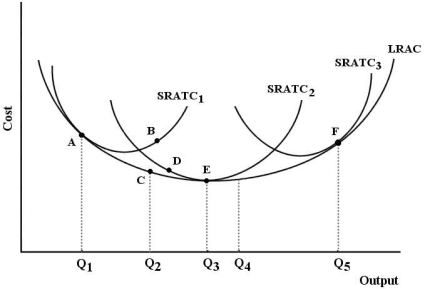 FIGURE 8-3
-Refer to Figure 8-3. Suppose this firm is producing output level Q₃ with plant size 2. Now suppose this firm changes to plant size 3 and is producing output level Q5. We can say that
A) output has increased exactly in proportion to the increase in inputs.
B) output has increased less than in proportion to the increase in inputs.
C) output has increased more than in proportion to the increase in inputs.
D) this firm has experienced economies of scale.
E) the firm is then operating with the optimal plant size.
Correct Answer:

Verified
Correct Answer:
Verified
Q1: <img src="https://d2lvgg3v3hfg70.cloudfront.net/TB5441/.jpg" alt=" FIGURE 8-1 -Refer
Q11: Assume a firm is using 10 units
Q30: A short- run average total cost curve
Q50: Which of the following statements concerning long-
Q55: The figure below shows the isocost lines
Q60: Suppose a firm experiences decreasing returns to
Q88: A firm's long- run average cost curve<br>A)
Q101: The figure below shows the isocost lines
Q103: Suppose that a firm is using 100
Q108: The figure below shows the isocost lines