Multiple Choice
The diagram below shows a set of budget lines facing a household. 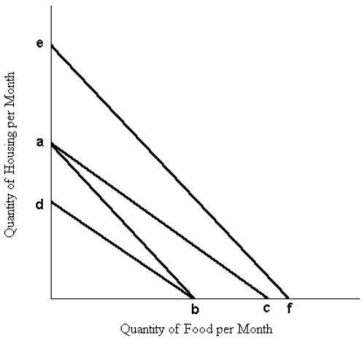 FIGURE 6- 7
-Refer to Figure 6- 7. The movement of the budget line from ab to ac could be caused by
A) an increase in the price of food.
B) a decrease in the price of housing.
C) a decrease in the price of food.
D) an increase in money income.
E) an increase in the price of housing.
Correct Answer:

Verified
Correct Answer:
Verified
Q24: An indifference curve plotted for two different
Q50: If John consumes only two goods, A
Q51: A demand curve for a normal good
Q52: In indifference curve analysis, the consumer's utility-
Q53: Consumer surplus is<br>A) the same as total
Q55: The table below shows the total
Q56: <img src="https://d2lvgg3v3hfg70.cloudfront.net/TB5438/.jpg" alt=" FIGURE 6- 8
Q57: A basic hypothesis of marginal utility theory
Q58: Suppose a consumer can purchase only two
Q59: <img src="https://d2lvgg3v3hfg70.cloudfront.net/TB5438/.jpg" alt=" FIGURE 6- 8