Multiple Choice
The diagram below shows two production possibilities boundaries for Country X. 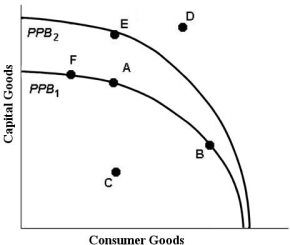 FIGURE 1- 3
-Refer to Figure 1- 3. Growth in the country's productive capacity is illustrated by
A) a movement from a point inside the boundary such as C to the boundary.
B) the movement between points on a given boundary.
C) a point like D outside the boundary.
D) a single point such as A on the boundary.
E) an outward shift of the boundary, for example from PPB1 to PPB2.
Correct Answer:

Verified
Correct Answer:
Verified
Q17: Scarcity arises from limited resources. For this
Q41: The table below shows that, in
Q41: The opportunity cost of going to college
Q42: The circular flow of income illustrates<br>A)the flows
Q45: Specialization and trade<br>A)developed only where government and
Q50: It has been observed that university enrollment
Q58: Suppose Andrea has a job that pays
Q62: The use of money for transactions<br>A)makes specialization
Q63: Katie and Hugh are producing pies and
Q71: The famous economist who developed the idea