Multiple Choice
The diagram below shows two production possibilities boundaries for Country X. 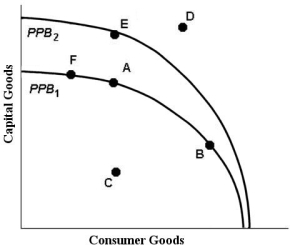 FIGURE 1- 3
-Refer to Figure 1- 3. If Country X is currently producing at point A, it could move to point B if
A) Country X is no longer able to produce the quantity of capital goods at point A.
B) some resources were switched from the consumption goods industries to the capital goods industries.
C) some resources were switched from the capital goods industries to the consumption goods industries.
D) the cost of producing consumer goods were to increase.
E) the cost of producing capital goods were to increase.
Correct Answer:

Verified
Correct Answer:
Verified
Q5: Suppose drought destroys many millions of acres
Q13: On a diagram of a production possibilities
Q21: Comparison of economic systems indicates that<br>A)capitalist economies
Q28: Economics is generally NOT concerned with<br>A)restricting the
Q29: Suppose fire destroy many millions of hectares
Q43: Specialization of labour means that<br>A)job security is
Q44: With regard to various economic systems, most
Q60: The diagram below shows two production possibilities
Q67: A country's production possibilities boundary shows that<br>A)when
Q68: Labour services are bought and sold in