Multiple Choice
Which of the following graphs illustrates the behavior of a total variable cost? 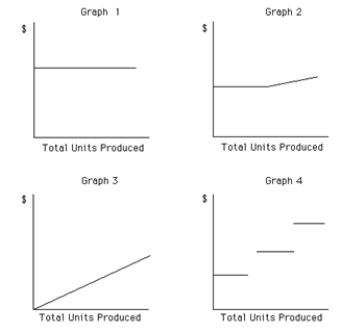
A) Graph 2
B) Graph 3
C) Graph 4
D) Graph 1
Correct Answer:

Verified
Correct Answer:
Verified
Related Questions
Q2: Wiles Inc.'s unit selling price is $40,
Q3: Variable costs as a percentage of sales
Q4: For purpose of analysis, mixed costs can
Q6: Direct materials cost is an example of
Q8: Which of the following conditions would cause
Q9: With the aid of computer software, managers
Q10: The ratio that indicates the percentage of
Q11: Kennedy Co.sells two products, Arks and
Q12: Compute the break-even point (in dollars) if
Q187: A production supervisor's salary that does not