Multiple Choice
Which of the following graphs illustrates the nature of a mixed cost?
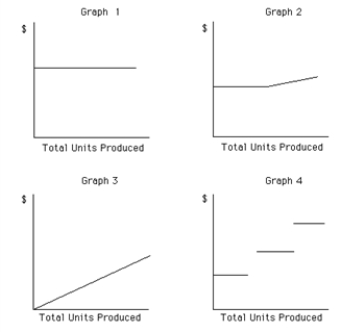
A) Graph 2
B) Graph 3
C) Graph 4
D) Graph 1
Correct Answer:

Verified
Correct Answer:
Verified
Related Questions
Q60: Which of the following statements is true
Q62: Which of the following is an example
Q64: Compute break-even sales (in units) when fixed
Q66: Kennedy Co.sells two products, Arks and
Q67: If fixed costs are $450,000 and the
Q68: Variable costs are costs that remain constant
Q69: If fixed costs are $750,000 and variable
Q70: If the volume of sales is $6,000,000
Q87: The fixed cost per unit varies with
Q115: When a business sells more than one