Multiple Choice
SCENARIO 2-2
2-2 Organizing and Visualizing Variables
At a meeting of information systems officers for regional offices of a national company,a survey was taken to determine the number of employees the officers supervise in the operation of their departments,where X is the number of employees overseen by each information systems officer.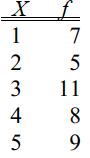
-The width of each bar in a histogram corresponds to the
A) differences between the boundaries of the class.
B) number of observations in each class.
C) midpoint of each class.
D) percentage of observations in each class.
Correct Answer:

Verified
Correct Answer:
Verified
Q106: SCENARIO 2-11<br>The ordered array below resulted from
Q107: SCENARIO 2-18<br>The stem-and-leaf display below shows the
Q108: SCENARIO 2-18<br>The stem-and-leaf display below shows the
Q109: SCENARIO 2-17<br>The following table presents total retail
Q110: SCENARIO 2-14 <br>The table below contains the
Q112: SCENARIO 2-6<br>A sample of 200 students at
Q113: SCENARIO 2-11<br>The ordered array below resulted from
Q114: SCENARIO 2-9<br>The frequency distribution below represents the
Q115: SCENARIO 2-14 <br>The table below contains the
Q116: SCENARIO 2-11<br>The ordered array below resulted from