Multiple Choice
A professor of economics at a small Texas university wanted to determine what year in school students were taking his tough economics course.Shown below is a pie chart of the results.What percentage of the class took the course prior to reaching their senior year? 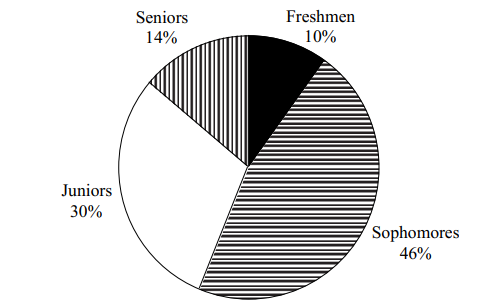
A) 14%
B) 44%
C) 54%
D) 86%
Correct Answer:

Verified
Correct Answer:
Verified
Q160: SCENARIO 2-14 <br>The table below contains the
Q161: SCENARIO 2-14 <br>The table below contains the
Q162: One of the advantages of a pie
Q163: SCENARIO 2-11<br>The ordered array below resulted from
Q164: Ogives are plotted at the midpoints of
Q166: A side-by-side bar chart is two histograms
Q167: The addition of visual elements that either
Q168: When comparing two or more large sets
Q169: SCENARIO 2-6<br>A sample of 200 students at
Q170: SCENARIO 2-14 <br>The table below contains the