Short Answer
SCENARIO 2-9
The frequency distribution below represents the rents of 250 randomly selected federally subsidized apartments in a small town.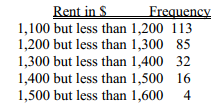
-Referring to Scenario 2-9,_____percent of the apartments rented for $1,400 or more.
Correct Answer:

Verified
Correct Answer:
Verified
Q29: SCENARIO 2-6<br>A sample of 200 students at
Q30: SCENARIO 2-7<br>The Stem-and-Leaf display below contains data
Q31: The Guidelines for Developing Visualizations recommend labeling
Q32: SCENARIO 2-8<br>The Stem-and-Leaf display represents the number
Q33: In general,a frequency distribution should have at
Q35: SCENARIO 2-14 <br>The table below contains the
Q36: SCENARIO 2-14 <br>The table below contains the
Q37: If you wish to construct a graph
Q38: SCENARIO 2-14 <br>The table below contains the
Q39: A multidimensional contingency table allows you to