Short Answer
SCENARIO 2-10
The histogram below represents scores achieved by 200 job applicants on a personality profile.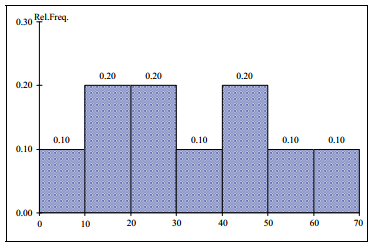
-Referring to the histogram from Scenario 2-10,_____percent of the job applicants scored below 50.
Correct Answer:

Verified
Correct Answer:
Verified
Q127: Data on the number of part-time hours
Q128: When constructing a frequency distribution,classes should be
Q129: The width of each class grouping or
Q130: Determining the class boundaries of a frequency
Q131: SCENARIO 2-10<br>The histogram below represents scores achieved
Q133: SCENARIO 2-18<br>The stem-and-leaf display below shows the
Q134: SCENARIO 2-18<br>The stem-and-leaf display below shows the
Q135: SCENARIO 2-14 <br>The table below contains the
Q136: SCENARIO 2-8<br>The Stem-and-Leaf display represents the number
Q137: SCENARIO 2-14 <br>The table below contains the