Short Answer
SCENARIO 2-10
The histogram below represents scores achieved by 200 job applicants on a personality profile.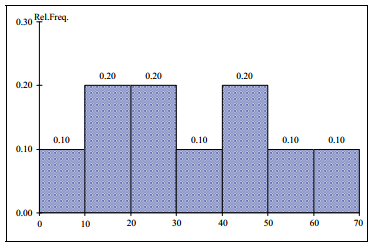
-Referring to the histogram from Scenario 2-10,_____percent of the applicants scored below 20 or at least 50.
Correct Answer:

Verified
Correct Answer:
Verified
Q167: The addition of visual elements that either
Q168: When comparing two or more large sets
Q169: SCENARIO 2-6<br>A sample of 200 students at
Q170: SCENARIO 2-14 <br>The table below contains the
Q171: SCENARIO 2-6<br>A sample of 200 students at
Q173: SCENARIO 2-5<br>The following are the duration in
Q174: SCENARIO 2-5<br>The following are the duration in
Q175: To evaluate two categorical variables at the
Q176: SCENARIO 2-8<br>The Stem-and-Leaf display represents the number
Q177: SCENARIO 2-14 <br>The table below contains the