True/False
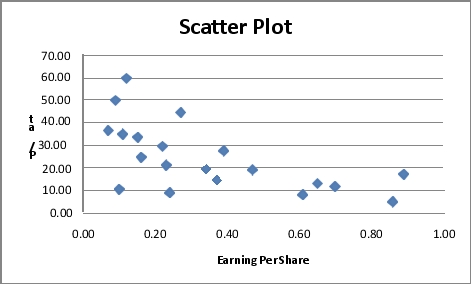
Given below is the scatter plot of the price/earnings ratio versus earnings per share of 20 U.S.companies.There appears to be a negative relationship between price/earnings ratio and earnings per share.
Correct Answer:

Verified
Correct Answer:
Verified
Q10: In graphing two categorical data,the side-by-side bar
Q11: SCENARIO 2-6<br>A sample of 200 students at
Q12: SCENARIO 2-4<br>A survey was conducted to determine
Q13: SCENARIO 2-14 <br>The table below contains the
Q14: In general,grouped frequency distributions should have between
Q16: If the values of the seventh and
Q17: When studying the simultaneous responses to two
Q18: SCENARIO 2-10<br>The histogram below represents scores achieved
Q19: In a contingency table,the number of rows
Q20: You have collected data on the approximate