menu-iconExamlexExamLexServices

Discover

Ask a Question
  1. All Topics
  2. Topic
    Statistics
  3. Study Set
    Basic Business Statistics Study Set 3
  4. Exam
    Exam 2: Organizing and Visualizing Variables
  5. Question
    Given Below Is the Scatter Plot of the Market Value
Solved

Given Below Is the Scatter Plot of the Market Value

Question 96

Question 96

True/False

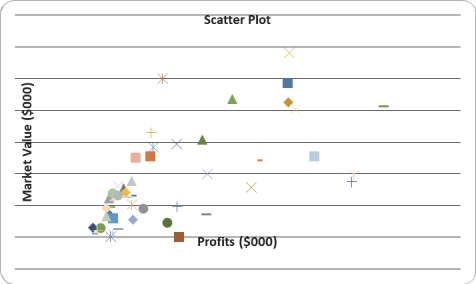
Given below is the scatter plot of the market value (thousands$)and profit (thousands$)of 50 U.S.companies.There appears to be a negative relationship between market value and profit.

Correct Answer:

verifed

Verified

Unlock this answer now
Get Access to more Verified Answers free of charge

Related Questions

Q91: SCENARIO 2-7<br>The Stem-and-Leaf display below contains data

Q92: SCENARIO 2-7<br>The Stem-and-Leaf display below contains data

Q93: A_ is a vertical bar chart in

Q94: SCENARIO 2-9<br>The frequency distribution below represents the

Q95: SCENARIO 2-14 <br>The table below contains the

Q97: SCENARIO 2-8<br>The Stem-and-Leaf display represents the number

Q98: A polygon can be constructed from a

Q99: When you work with many variables,you must

Q100: SCENARIO 2-14 <br>The table below contains the

Q101: The sum of relative frequencies in a

Examlex

ExamLex

About UsContact UsPerks CenterHomeschoolingTest Prep

Work With Us

Campus RepresentativeInfluencers

Links

FaqPricingChrome Extension

Download The App

Get App StoreGet Google Play

Policies

Privacy PolicyTerms of ServiceHonor CodeCommunity Guidelines

Scan To Download

qr-code

Copyright © (2025) ExamLex LLC.

Privacy PolicyTerms Of ServiceHonor CodeCommunity Guidelines