True/False
Given below is the scatter plot of the number of employees and the total revenue ($millions)of 20 U.S.companies.Companies that have higher numbers of employees appear to also have higher total revenue. 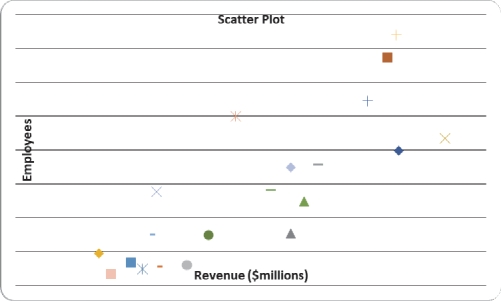
Correct Answer:

Verified
Correct Answer:
Verified
Q145: The larger the number of observations in
Q146: SCENARIO 2-17<br>The following table presents total retail
Q147: SCENARIO 2-14 <br>The table below contains the
Q148: SCENARIO 2-1<br>An insurance company evaluates many numerical
Q149: Relationships in a contingency table can be
Q151: A Walmart store in a small town
Q152: SCENARIO 2-10<br>The histogram below represents scores achieved
Q153: SCENARIO 2-14 <br>The table below contains the
Q154: Which of the following is appropriate for
Q155: SCENARIO 2-14 <br>The table below contains the