Multiple Choice
SCENARIO 13-9
It is believed that, the average numbers of hours spent studying per day (HOURS) during undergraduate education should have a positive linear relationship with the starting salary (SALARY, measured in thousands of dollars per month) after graduation. Given below is the Excel output for predicting starting salary (Y) using number of hours spent studying per day (X) for a sample of 51 students. NOTE: Only partial output is shown.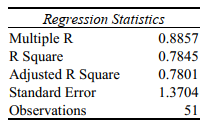
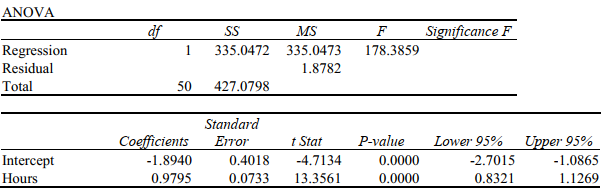
Note: 2.051 E - 05 = 2.051*10-5 and 5.944 E -18 = 5.944 *10 -18 .
-Referring to Scenario 13-8,the interpretation of the coefficient of determination in this regression is
A) 57.74% of the total variation of ACT scores can be explained by GPA.
B) ACT scores account for 57.74% of the total fluctuation in GPA.
C) GPA accounts for 57.74% of the variability of ACT scores.
D) None of the above.
Correct Answer:

Verified
Correct Answer:
Verified
Q116: SCENARIO 13-9<br>It is believed that, the average
Q117: SCENARIO 13-12<br>The manager of the purchasing department
Q118: SCENARIO 13-12<br>The manager of the purchasing department
Q119: SCENARIO 13-13<br>In this era of tough economic
Q120: SCENARIO 13-4<br>The managers of a brokerage firm
Q122: SCENARIO 13-4<br>The managers of a brokerage firm
Q123: SCENARIO 13-13<br>In this era of tough economic
Q124: SCENARIO 13-3<br>The director of cooperative education at
Q125: SCENARIO 13-4<br>The managers of a brokerage firm
Q126: SCENARIO 13-4<br>The managers of a brokerage firm