True/False
SCENARIO 17-1
The table below contains the sparklines for the rates of return (in percentage)for three different stocks from 2007 to 2013.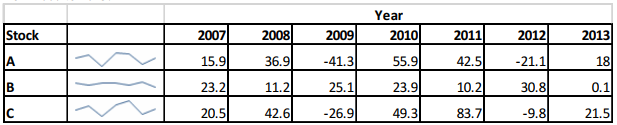
-Referring to Scenario 17-1,the sparklines enable you to draw conclusions on the historical trend of the rates of return of the three stocks.
Correct Answer:

Verified
Correct Answer:
Verified
Q1: In real-world business analytics,filtering is typically performed
Q2: Which of the following is NOT among
Q4: Ward's minimum variance can be used to
Q5: The prescriptive analytics technique in which the
Q6: In multidimensional scaling,the general rule is to
Q7: SCENARIO 17-1<br>The table below contains the sparklines
Q8: SCENARIO 17-7<br>The output below shows the results
Q9: Most information design specialists prefer bullet graphs
Q10: Neural networks do not make any a
Q11: Which of the following disciplines is typically