Short Answer
SCENARIO 17-3
The tree diagram below shows the results of the classification tree model that has been constructed to predict the probability of a cable company's customers who will switch ("Yes" or "No")into its bundled program offering based on the price ($30,$40,$50,$60)and whether the customer spends more than 5 hours a day watching TV ("Yes" or "No")using the data set of 100 customers collected from a survey.

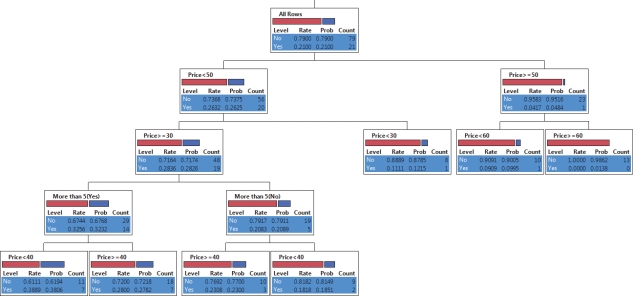
-Referring to Scenario 17-3,the first split occurs at what price?
Correct Answer:

Verified
Correct Answer:
Verified
Q37: Some consider bullet graphs little more than
Q38: Some business analytics involve starting with many
Q39: SCENARIO 17-4<br>The regression tree below was obtained
Q40: Neural networks can suffer from poor quality
Q41: Splitting of a node might be followed
Q43: SCENARIO 17-2<br>The treemap below shows the amounts
Q44: SCENARIO 17-1<br>The table below contains the sparklines
Q45: Neural networks use the validating data to
Q46: Dashboards may contain all but which of
Q47: Data mining is used mostly in the