Short Answer
SCENARIO 17-3
The tree diagram below shows the results of the classification tree model that has been constructed to predict the probability of a cable company's customers who will switch ("Yes" or "No")into its bundled program offering based on the price ($30,$40,$50,$60)and whether the customer spends more than 5 hours a day watching TV ("Yes" or "No")using the data set of 100 customers collected from a survey.

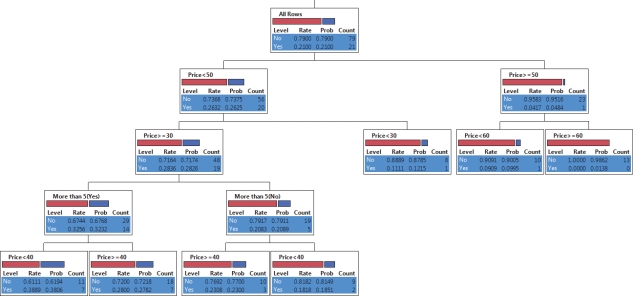
-Referring to Scenario 17-3,what is the highest rate of switching into the bundled offering?
Correct Answer:

Verified
Correct Answer:
Verified
Q103: In a regression tree,the dependent variable is
Q104: SCENARIO 17-4<br>The regression tree below was obtained
Q105: Successful implementation of a regression tree requires
Q106: There is no significant difference between filtering
Q107: The result of the regression tree is
Q108: Single linkage can be used to measure
Q110: Bullet graphs that use color to represent
Q111: SCENARIO 17-2<br>The treemap below shows the amounts
Q112: Euclidean distance can be used to measure
Q113: The LogWorth statistic is used to decide