True/False
SCENARIO 17-3
The tree diagram below shows the results of the classification tree model that has been constructed to predict the probability of a cable company's customers who will switch ("Yes" or "No")into its bundled program offering based on the price ($30,$40,$50,$60)and whether the customer spends more than 5 hours a day watching TV ("Yes" or "No")using the data set of 100 customers collected from a survey.

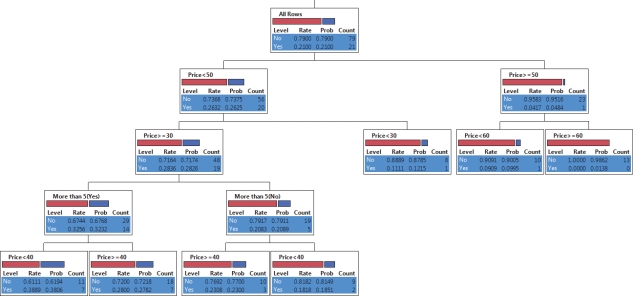
-Referring to Scenario 17-3,the highest probability of switching is predicted to occur among customers who watch more than 5 hours of TV a day and are offered the bundled price of higher than $50.
Correct Answer:

Verified
Correct Answer:
Verified
Q21: SCENARIO 17-7<br>The output below shows the results
Q22: The G <sup>2</sup><br>statistic is a measure of
Q23: In multidimensional scaling,the stress statistic is used
Q24: Some business analytics involve starting with many
Q25: SCENARIO 17-3<br>The tree diagram below shows the
Q27: SCENARIO 17-6<br>The neural network output below was
Q28: Which of the following is NOT one
Q29: Dashboards may contain all but which of
Q30: SCENARIO 17-5<br>The output below shows the results
Q31: SCENARIO 17-2<br>The treemap below shows the amounts