Short Answer
SCENARIO 17-4
The regression tree below was obtained for predicting the weekend box office revenue of a newly released movie (in thousands of dollars)based on data collected in different cities on the expenditure (at $25,$30,$35,$40,$45,$50,$55,$60,$65 or $70 thousand)spent on TV advertising and the number of times (10,15,20,25,30 or 35)a day the advertisement appear on TV.
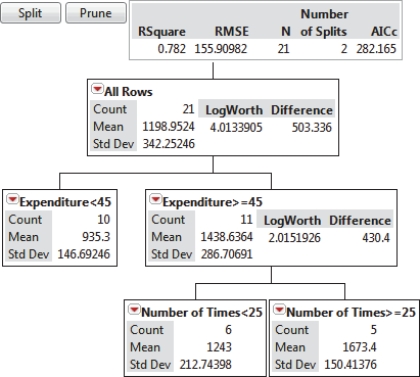
-Referring to Scenario 17-4,what percentage of the variation in weekend box office revenue can be explained by the amount spent on TV advertising and the number of times a day the advertisement appear on TV?
Correct Answer:

Verified
Correct Answer:
Verified
Q43: SCENARIO 17-2<br>The treemap below shows the amounts
Q44: SCENARIO 17-1<br>The table below contains the sparklines
Q45: Neural networks use the validating data to
Q46: Dashboards may contain all but which of
Q47: Data mining is used mostly in the
Q49: Splitting is always followed by pruning in
Q50: Average linkage can be used to measure
Q51: The Akaike information criteria (AIC)or the corrected
Q52: The LogWorth statistic is a measure of
Q53: SCENARIO 17-3<br>The tree diagram below shows the