Multiple Choice
SCENARIO 19-3
A quality control analyst for a light bulb manufacturer is concerned that the time it takes to produce a batch of light bulbs is too erratic.Accordingly,the analyst randomly surveys 10 production periods each day for 14 days and records the sample mean and range for each day.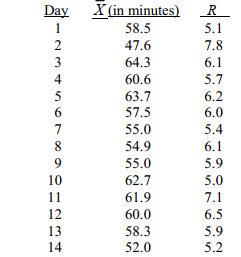
-Referring to Scenario 19-3,suppose the analyst constructs an R chart to see if the variability in production times is in-control.The R chart is characterized by which of the following?
A) Increasing trend
B) Decreasing trend
C) In-control
D) Points outside the control limits
Correct Answer:

Verified
Correct Answer:
Verified
Q55: The R chart is a control chart
Q56: SMED establishes ways to clean and maintain
Q57: C<sub>pk</sub> > 1 indicates that the process
Q58: SCENARIO 19-9<br>The manufacturer of canned food constructed
Q59: SCENARIO 19-10<br>Below is the number of defective
Q61: SCENARIO 19-4<br>A factory supervisor is concerned that
Q62: The CPL and CPU indexes are used
Q63: Mistake Proofing devices focus on methods that
Q64: SCENARIO 19-8<br>Recently,a university switched to a new
Q65: A process capability is estimated by the