Multiple Choice
SCENARIO 19-3
A quality control analyst for a light bulb manufacturer is concerned that the time it takes to produce a batch of light bulbs is too erratic.Accordingly,the analyst randomly surveys 10 production periods each day for 14 days and records the sample mean and range for each day.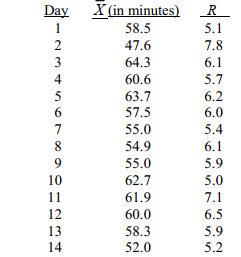
-Referring to Scenario 19-3,suppose the analyst constructs an x̄ chart to see if the production process is in-control.Which expression best describes this chart?
A) In-control
B) Increasing trend
C) Decreasing trend
D) Individual outliers
Correct Answer:

Verified
Correct Answer:
Verified
Q34: SCENARIO 19-7<br>A supplier of silicone sheets for
Q35: SCENARIO 19-10<br>Below is the number of defective
Q36: The cause of variation that can be
Q37: Maintaining the gains that have been made
Q38: SCENARIO 19-6<br>The maker of a packaged candy
Q40: SCENARIO 19-10<br>Below is the number of defective
Q41: SCENARIO 19-8<br>Recently,a university switched to a new
Q42: Variation signaled by individual fluctuations or patterns
Q43: SCENARIO 19-4<br>A factory supervisor is concerned that
Q44: It is not possible for the x̄