Multiple Choice
SCENARIO 19-4
A factory supervisor is concerned that the time it takes workers to complete an important production task (measured in seconds) is too erratic and adversely affects expected profits.The supervisor proceeds by randomly sampling 5 individuals per hour for a period of 10 hours.The sample mean and range for each hour are listed below.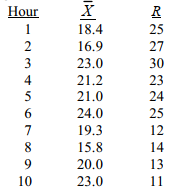 She also decides that lower and upper specification limit for the critical-to-quality variable should be 10 and 30 seconds,respectively.
-Referring to Scenario 19-4,suppose the sample mean and range data were based on 6 observations per hour instead of 5.How would this change affect the lower and upper control limits of an R chart?
A) LCL would increase;UCL would decrease.
B) LCL would remain the same;UCL would decrease.
C) Both LCL and UCL would remain the same.
D) LCL would decrease;UCL would increase.
Correct Answer:

Verified
Correct Answer:
Verified
Q21: SCENARIO 19-9<br>The manufacturer of canned food constructed
Q22: In the United States,the control limits on
Q23: SCENARIO 19-7<br>A supplier of silicone sheets for
Q24: SCENARIO 19-7<br>A supplier of silicone sheets for
Q25: Quick Changeover Techniques establish ways to clean
Q27: A process is said to be out
Q28: SS method focuses on preventing the causes
Q29: SCENARIO 19-7<br>A supplier of silicone sheets for
Q30: SCENARIO 19-8<br>Recently,a university switched to a new
Q31: SCENARIO 19-7<br>A supplier of silicone sheets for