Multiple Choice
The table below gives beverage preferences for random samples of teens and adults. 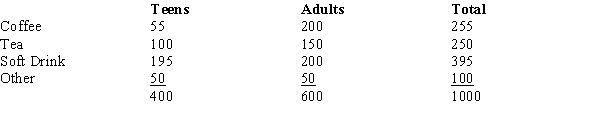 We are asked to test for independence between age (i.e., adult and teen) and drink preferences.The test statistic for this test of independence is
A) 0.
B) 8.4.
C) 62.5.
D) 54.7.
Correct Answer:

Verified
Correct Answer:
Verified
Related Questions
Q1: In the past, 35% of the students
Q7: The degrees of freedom for a table
Q8: In the past, 35% of the students
Q25: The sampling distribution for a goodness of
Q26: The test for goodness of fit, test
Q41: In 2002, 40% of the students at
Q47: Last school year, the student body of
Q48: When individuals in a sample of 150
Q49: The owner of a car wash wants
Q54: A group of 2000 individuals from 3