Short Answer
The following frequency distribution shows the GMAT scores of a sample of MBA students: 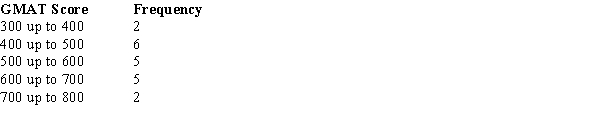
For the above data, compute the mean GMAT score.
Correct Answer:

Verified
Correct Answer:
Verified
Related Questions
Q1: Which of the following symbols represents the
Q5: Last semester grades of Michael, a freshman
Q9: The following is the frequency distribution for
Q52: For data skewed to the left, the
Q62: The descriptive measure of variability that is
Q69: The geometric mean of 1, 1, 8
Q101: Since the mode is the most frequently
Q108: The pth percentile is a value such
Q109: A box plot is a graphical representation
Q110: In 2012, the average donation to the