Essay
The frequency distribution below was constructed from data collected on the quarts of soft drinks consumed per week by 20 students. 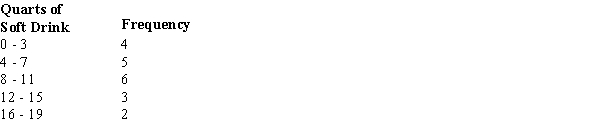
a.
Construct a relative frequency distribution.
b.
Construct a cumulative frequency distribution.
c.
Construct a cumulative relative frequency distribution.
Correct Answer:

Verified
Correct Answer:
Verified
Q2: A cumulative relative frequency distribution shows<br>A) the
Q15: In a crosstabulation<br>A) both variables must be
Q18: A histogram is<br>A) a graphical presentation of
Q36: In a cumulative relative frequency distribution, the
Q54: The numbers of hours worked (per week)
Q55: There are 800 students in the School
Q57: A sample of 15 children shows their
Q59: Which of the following types of data
Q63: A sample of fifteen 7-year old boys
Q64: A cumulative frequency distribution is<br>A) a tabular