Multiple Choice
A survey of 800 college seniors resulted in the following crosstabulation regarding their undergraduate major and whether or not they plan to go to graduate school. 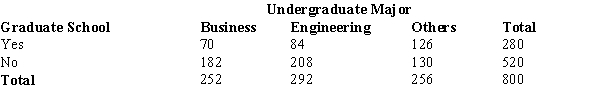 The above crosstabulation shows
A) frequencies.
B) row percentages.
C) column percentages.
D) overall percentages.
Correct Answer:

Verified
Correct Answer:
Verified
Q6: Which of the following is least useful
Q8: A tabular summary of a set of
Q11: A display used to compare the frequency,
Q17: The numbers of hours worked on homework
Q34: Which of the following graphical methods shows
Q38: Histograms based on data on housing prices
Q39: The most common graphical presentation of quantitative
Q47: In a scatter diagram, a line that
Q49: A graphical method that can be used
Q61: A frequency distribution is a tabular summary