Multiple Choice
The following graph shows the volume of wood produced in a single-species forest.Here  is measured in cubic meters/hectare and t is measured in years.By computing the slopes of the respective tangent lines, estimate the rate at which the wood grown is changing at the beginning of year 10 and at the beginning of year 35.
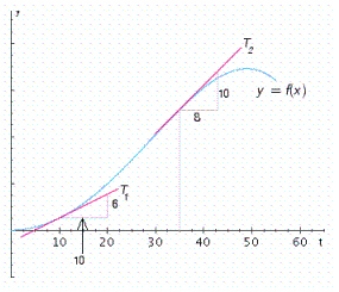
A)  cubic meters/hectare per year in the year 10,


 cubic meters/hectare per year in the year 35
B)  cubic meters/hectare per year in the year 10,


 cubic meters/hectare per year in the year 35
C)  cubic meters/hectare per year in the year 10,


 cubic meters/hectare per year in the year 35
D)  cubic meters/hectare per year in the year 10,


 cubic meters/hectare per year in the year 35
Correct Answer:

Verified
Correct Answer:
Verified
Q192: The volume of a spherical cancerous tumor
Q193: Let <img src="https://d2lvgg3v3hfg70.cloudfront.net/TB7866/.jpg" alt="Let ,
Q194: For the demand equation <img src="https://d2lvgg3v3hfg70.cloudfront.net/TB7866/.jpg" alt="For
Q195: Find <img src="https://d2lvgg3v3hfg70.cloudfront.net/TB7866/.jpg" alt="Find given
Q196: Use the graph of the function f
Q198: Find the limit, if it exists. <img
Q199: A study of driving costs of 1992
Q200: Find the domain of the function <img
Q201: Determine all values of x at which
Q202: The oxygen consumption (in milliliter/pound/minute) for a