Multiple Choice
Productivity and yield of cultivated crops are often reduced by insect pests.The following graph shows the relationship between the yield of a certain crop,  , as a function of the density of aphids x.(Aphids are small insects that suck plant juices.) Here,
  is measured in kilograms/ 4,000 square meters, and x is measured in hundreds of aphids/bean stem.By computing the slopes of the respective tangent lines, estimate the rate of change of the crop yield with respect to the density of aphids when that density is 200 aphids/bean stem and when it is 800 aphids/bean stem.
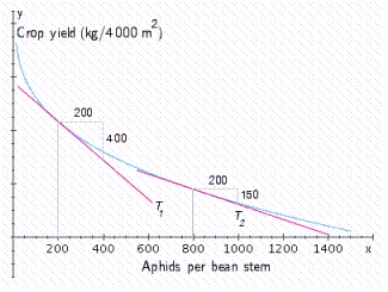
A) - 0.5 when it is 200 aphids/bean stem, 

 - 1.333 when it is 800 aphids/bean stem
B) 2 when it is 200 aphids/bean stem, 

 0.75 when it is 800 aphids/bean stem
C) - 2 when it is 200 aphids/bean stem, 

 - 0.75 when it is 800 aphids/bean stem
D) 0.5 when it is 200 aphids/bean stem, 

 1.333 when it is 800 aphids/bean stem
Correct Answer:

Verified
Correct Answer:
Verified
Q74: The position of car A and car
Q75: Use the four-step process to find the
Q76: Let <img src="https://d2lvgg3v3hfg70.cloudfront.net/TB7866/.jpg" alt="Let ,
Q77: Use the graph of the given function
Q79: Determine all values of x at which
Q80: Determine all values of x at which
Q81: Let <img src="https://d2lvgg3v3hfg70.cloudfront.net/TB7866/.jpg" alt="Let Find
Q82: Determine whether the equation defines y as
Q83: Determine whether the given function is a
Q255: An apple orchard has an average yield