Essay
The graph shows the volume of wood produced in a single-species forest.Here  is measured in cubic meters/hectare and t is measured in years.By computing the slopes of the respective tangent lines, estimate the rate at which the wood grown is changing at the beginning of year 10 and at the beginning of year 40.
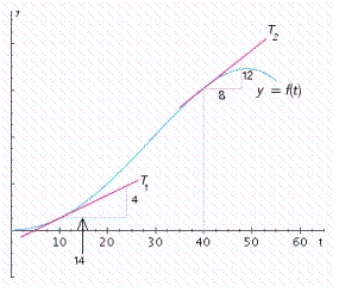
Correct Answer:

Verified
Correct Answer:
Verified
Q35: Economists define the disposable annual income for
Q123: The number of IBM shares that Nancy
Q141: Let <img src="https://d2lvgg3v3hfg70.cloudfront.net/TB7866/.jpg" alt="Let ,
Q144: For the pair of supply and demand
Q145: Use the four-step process to find the
Q147: Find the indicated limit, if it exists.Otherwise,
Q148: The circumference of a circle is given
Q149: If f and g are functions, then
Q150: Determine whether the point (- 6, -
Q151: The revenue (in dollars) realized by Apollo