Multiple Choice
The ratio of working-age population to the elderly in the United States (including projections after 2000) is given by 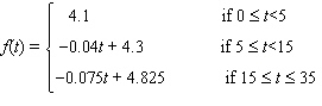 with t = 0 corresponding to the beginning of 1995.What will be the ratio at the beginning of 2005?
A) f(1995) = -75.5
B) f(1995) = 75.5
C) f(10) = -3.9
D) f(10) = 4.7
E) f(10) = 3.9
Correct Answer:

Verified
Correct Answer:
Verified
Q173: Under a set of controlled laboratory conditions,
Q174: Find the limit, if it exists. <img
Q175: Find and simplify <img src="https://d2lvgg3v3hfg70.cloudfront.net/TB7866/.jpg" alt="Find and
Q176: Use the four-step process to find the
Q177: Find the limit, if it exists. <img
Q179: Find the functions f + g, f
Q180: Find the limit. <img src="https://d2lvgg3v3hfg70.cloudfront.net/TB7866/.jpg" alt="Find the
Q181: Find the indicated one-sided limit. <img src="https://d2lvgg3v3hfg70.cloudfront.net/TB7866/.jpg"
Q182: The volume of a spherical cancerous tumor
Q183: Let <img src="https://d2lvgg3v3hfg70.cloudfront.net/TB7866/.jpg" alt="Let .