Essay
The ratio of working-age population to the elderly in the United States (including projections after 2000) is given by 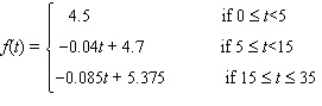 with t = 0 corresponding to the beginning of 1995.
Round the answers to two decimal places, if necessary.
What will be the ratio at the beginning of 2005?
__________
At the beginning of 2020?
__________
Correct Answer:

Verified
Correct Answer:
Verified
Q4: Use the intermediate value theorem to find
Q5: Find the values of x for which
Q6: Refer to the graph of the function
Q7: Determine whether the given function is a
Q8: Let <img src="https://d2lvgg3v3hfg70.cloudfront.net/TB7866/.jpg" alt="Let ,
Q10: Find the limit, if it exists. <img
Q11: Use the four-step process to find the
Q12: <img src="https://d2lvgg3v3hfg70.cloudfront.net/TB7866/.jpg" alt=" A)
Q13: The function that gives the cost of
Q14: Find the indicated one-sided limit. <img src="https://d2lvgg3v3hfg70.cloudfront.net/TB7866/.jpg"