Multiple Choice
The figure given below depicts the IS-LM-FE model with floating exchange rates. 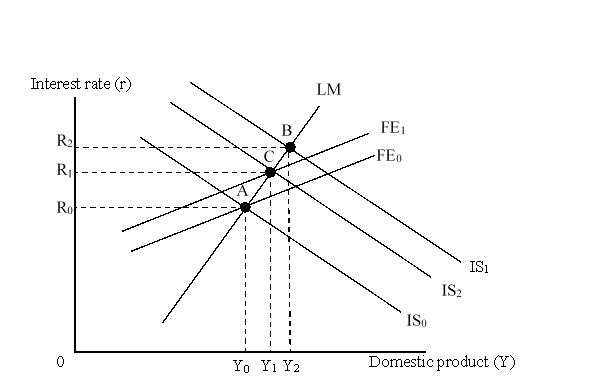 The shift of the IS curve from IS1 to IS2 was caused by:
A) a contractionary monetary policy.
B) official intervention in the foreign exchange market.
C) an improvement in current account position.
D) a worsening of international price competitiveness.
Correct Answer:

Verified
Correct Answer:
Verified
Q17: Other fundamental things equal, an increase in
Q18: The figure given below depicts the IS-LM-FE
Q19: Monetary policy is more effective with fixed
Q20: An expansion of the money supply by
Q21: If there is a shift of international
Q23: Which of the following is most likely
Q24: Under a floating exchange rate regime with
Q25: Monetary expansion, with perfect capital mobility, is
Q26: International crowding out is the tendency of
Q27: Under a floating exchange rate regime with