Multiple Choice
The figure given below illustrates the market for British pounds. D£ and S£ are the demand and supply curves of the British pounds respectively. 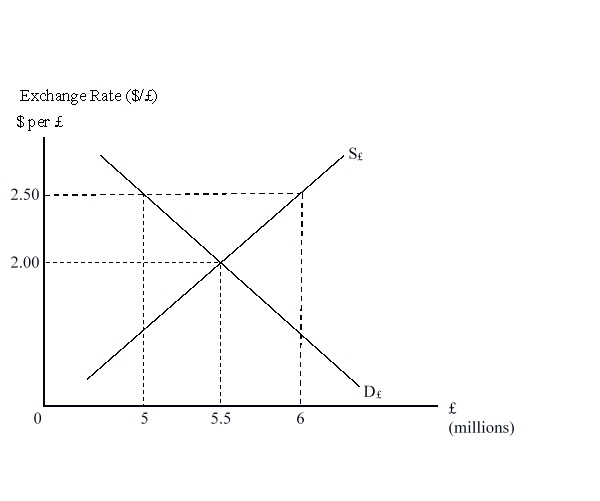 If the British government wants to peg the dollar per pound exchange rate at $2.50 per pound, what action would British monetary authorities have to undertake?
A) Sell 1 million pounds and buy 2.5 million dollars
B) Buy 1 million pounds and sell 1 million dollars
C) Buy 1 million pounds and sell 2.5 million dollars
D) Buy 6 million pounds and sell 12 million dollars
Correct Answer:

Verified
Correct Answer:
Verified
Q18: Exchange rates are equalized in different locations
Q19: A decrease in German residents' willingness to
Q20: Suppose the dollar per pound exchange rate
Q21: Most foreign exchange trading is done among
Q22: The figure given below illustrates the market
Q24: The U.S. dollar is called a _
Q25: A retailer in Mexico wants to buy
Q26: Which of the following refers to foreign
Q27: Under a floating exchange rate system, the
Q28: The figure given below illustrates the market