Multiple Choice
The figure given below illustrates the market for British pounds. D£ and S£ are the demand and supply curves of the British pounds respectively. 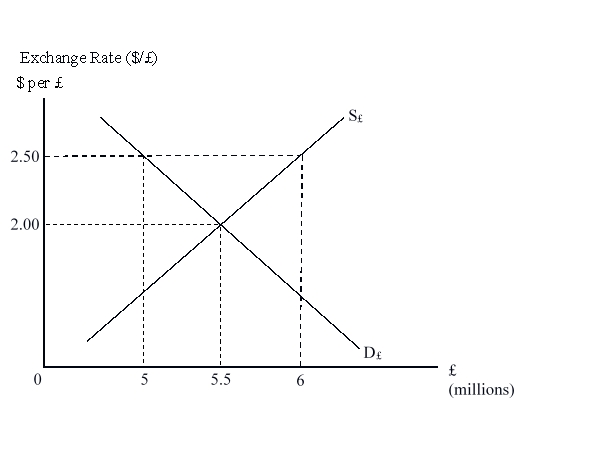 Suppose initially the exchange rate is pegged at $2.50 per pound. If the governments allow the pound to float, the pound will experience a(n) :
A) surplus.
B) buoyant period.
C) appreciation.
D) depreciation.
Correct Answer:

Verified
Correct Answer:
Verified
Q44: Triangular arbitrage does not cause the cross
Q45: The greater part of the money assets
Q46: If the price of British pounds in
Q47: When the exchange rate is set now
Q48: A country's demand for foreign currency is
Q50: Other things remaining unchanged, if American exports
Q51: An increase in capital inflows in the
Q52: The 2004-2014 rapid growth in global foreign
Q53: French imports of goods and services will
Q54: The Maastricht Treaty adopted by the EU