Multiple Choice
The figure given below represents the effects in the labor markets due to migration. Here the world has been divided into a high-income "North" (left panel) and a low-income "South" (right panel) . Dn and Sn are the labor demand and the labor supply curves in North. Ds and (Sr + Smig) are the labor demand and pre-migration labor supply curves in South. Sr is the post-migration labor supply curve in South. The value c is the cost of migrating. 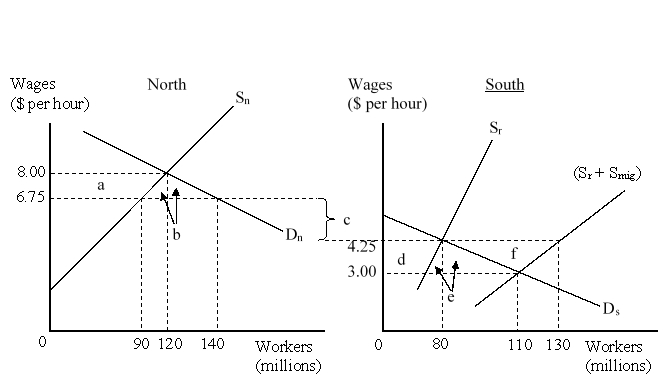 When migration is not allowed, workers in North earn _____ per hour and workers in South earn _____ per hour.
A) $6.75; $4.25
B) $8.00; $4.25
C) $6.75; $3.00
D) $8.00; $3.00
Correct Answer:

Verified
Correct Answer:
Verified
Q17: Which of the following ways can an
Q18: How can an MNE overcome its inherent
Q19: A multinational enterprise produces a component in
Q20: Which of the following is true for
Q21: Countries that grow the fastest are those
Q23: Which of the following is a likely
Q24: Which of the following statements is true
Q25: Import tariffs and non-tariff barriers suggest that:<br>A)FDI
Q26: In the case in which foreign affiliates
Q27: Should receiving countries ban all forms of