Multiple Choice
The figure given below represents the effects in the labor markets due to migration. Here the world has been divided into a high-income "North" (left panel) and a low-income "South" (right panel) . Dn and Sn are the labor demand and the labor supply curves in North. Ds and (Sr + Smig) are the labor demand and pre-migration labor supply curves in South. Sr is the post-migration labor supply curve in South. The value c is the cost of migrating. 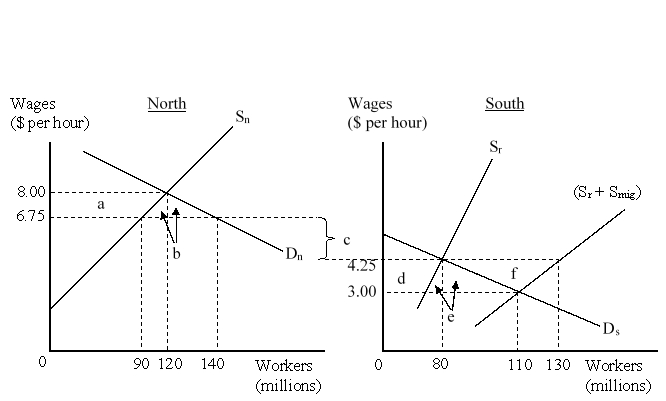 After the migration, the native employees in North:
A) lose welfare given by area 'a'.
B) gain welfare given by area (a+b) .
C) lose welfare given by area (a+b) .
D) lose welfare given by area (e + f) .
Correct Answer:

Verified
Correct Answer:
Verified
Q10: One measure that would compensate the sending
Q11: The existence of migration costs implies that
Q12: Which of the following is NOT a
Q13: As some government spending is for true
Q14: How do the characteristics of immigrants influence
Q16: Multinationals typically operate in a market structure
Q17: Which of the following ways can an
Q18: How can an MNE overcome its inherent
Q19: A multinational enterprise produces a component in
Q20: Which of the following is true for