Multiple Choice
The figure given below shows the national market for mopeds in a country. Dd and Sd are the domestic demand and supply curves of mopeds respectively. 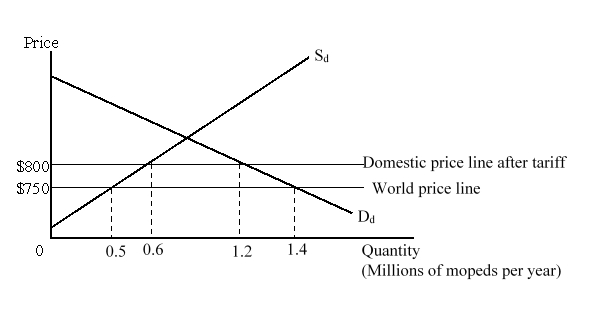 The figure given below shows the marginal external benefit curve (MEB) of the country from the production of domestic mopeds.
 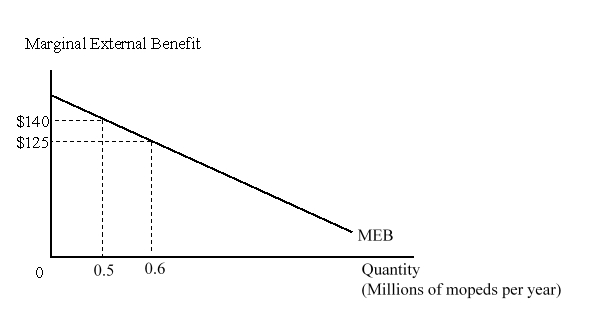 The overall impact of the tariff on the nation would be:
A) a loss of $15 million.
B) a loss of $20.75 million.
C) a gain of $13.25 million.
D) a gain of $5.75 million.
Correct Answer:

Verified
Correct Answer:
Verified
Q8: What is most likely to happen when
Q9: Government loans are more efficient than production
Q10: If additional domestic production will lead to
Q11: Which of the following statements reflects a
Q12: The _ states that it is usually
Q14: Which of the following refers to the
Q15: The figure given below shows the national
Q16: Direct democracy makes tariffs less likely to
Q17: Too much of a good is produced
Q18: The United States could begin building a