Multiple Choice
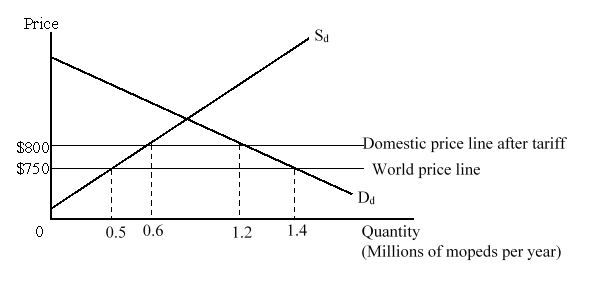
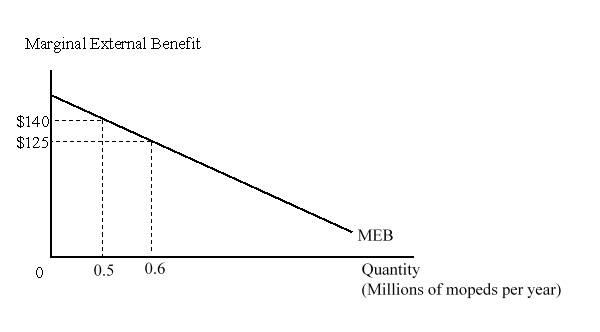
The figure given below shows the national market for mopeds in a country. Dd and Sd are the domestic demand and supply curves of mopeds respectively.  The figure given below shows the marginal external benefit curve (MEB) of the country from the production of domestic mopeds.
  If there is initially free trade, and then a $50 per unit subsidy is given to the domestic producers of mopeds, domestic consumption of mopeds would:
A) increase by 100,000 units.
B) decrease by 200,000 units.
C) decrease by 600,000 units.
D) remain unchanged.
Correct Answer:

Verified
Correct Answer:
Verified
Q49: Which of the following is true of
Q50: Suppose manufacturing of paper results in substantial
Q51: If Social Marginal Benefit (SMB) > Price
Q52: The figure given below shows the national
Q53: While trade restrictions do provide gains to
Q55: In a "second-best" world:<br>A)tariffs are economically optimal.<br>B)private
Q56: The figure given below shows the national
Q57: Which of the following arguments for protection
Q58: "It is good to protect domestic production
Q59: External effects from a transaction indicate that