Multiple Choice
The figure given below shows the market for shoes in the U.S. The domestic price line with tariff lies above the international price line. Dd and Sd are the domestic demand and supply curves of shoes respectively. 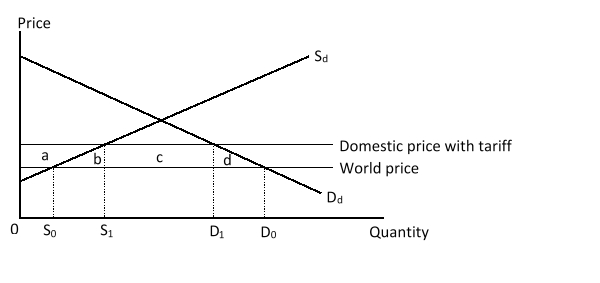 Following the imposition of tariff, the domestic consumer surplus _____ by the area _____.
A) increases; c + d
B) decreases; d
C) decreases; (a + b + c +d)
D) increases; (b + d)
Correct Answer:

Verified
Correct Answer:
Verified
Q49: When a tariff is imposed on an
Q50: At free-trade prices, a bicycle in country
Q51: The nationally optimal tariff is the tariff
Q52: A competitive producer supplies an additional unit
Q53: The one-dollar, one-vote metric implies that every
Q55: The figure given below shows the market
Q56: Within a country, a tariff causes a
Q57: The figure given below shows the market
Q58: For a small country, the sum of
Q59: When a small country imposes a tariff,