Multiple Choice
The figure given below shows the market for shoes in the U.S. The domestic price line with tariff lies above the international price line. Dd and Sd are the domestic demand and supply curves of shoes respectively. 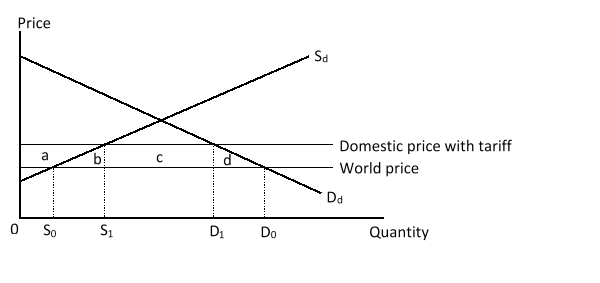 The consumption effect of the tariff on shoes is measured by the area _____.
A) a
B) b
C) c
D) d
Correct Answer:

Verified
Correct Answer:
Verified
Q12: A tariff imposed by a small country
Q13: Which of the following has overseen the
Q14: If the imposition of tariff on a
Q15: The figure given below shows the market
Q16: The production effect of a tariff measures
Q18: Which of the following is an impact
Q19: A large country can gain from imposing
Q20: Which of the following statements is NOT
Q21: Under free trade, a large country produces
Q22: An ad valorem tariff is formulated as