Multiple Choice
The figure given below shows the production-possibility curves of Canada (AB) and the Rest of the World (CD) . The pre-trade price ratio in Canada and the Rest of the World are given by the lines P1 and P3 respectively. The international price ratio faced by the countries is represented by the line P2. I?1 and I2 are the pre-trade and post-trade social indifference curves for both Canada and the Rest of the World respectively. Before Canada entered into a trade with the rest of the world, the total amount of cotton produced in the world was _____ bales and the total amount of wheat produced in the world was _____ bushels. 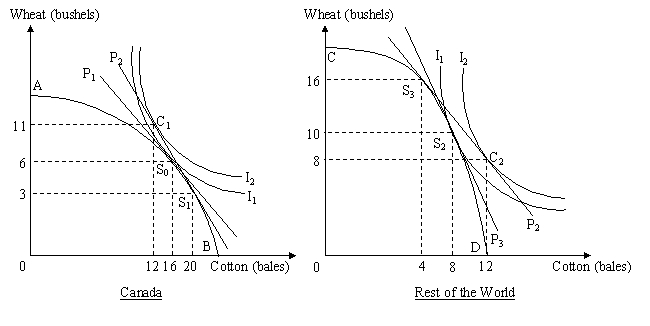
A) 24; 19
B) 24; 16
C) 19; 24
D) 18; 24
Correct Answer:

Verified
Correct Answer:
Verified
Q38: After the North American Free Trade Agreement
Q39: Assume a two-country two-good two-input model where
Q40: The community indifference curves illustrate the technological
Q41: Increasing-cost production-possibility curves are bowed out from
Q42: In the figure given below AB is
Q44: In international trade jargon, constant cost production-possibility
Q45: Which of the following statements is true
Q46: China has 20% of the world's population
Q47: Assume that country X produces two goods-sugar
Q48: The figure given below shows the post-trade