Multiple Choice
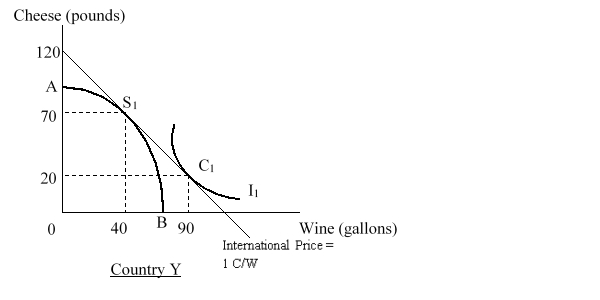
The figure given below shows the post-trade production and consumption points in country Y. AB is the production-possibility curve of country Y. I1 is the community indifference curve of country Y. Country Y imports: 
A) 40 gallons of wine.
B) 60 pounds of cheese.
C) 50 gallons of wine.
D) 80 pounds of cheese.
Correct Answer:

Verified
Correct Answer:
Verified
Q4: In the absence of trade, a country
Q5: The table given below shows the
Q6: If country A is relatively abundant in
Q7: According to the Heckscher-Ohlin theory, if the
Q8: Using the concepts of community indifference curves
Q10: Explain the differences between the two-country two-good
Q11: If country A is relatively land-abundant and
Q12: Assume a two-country, two-good, and two inputs
Q13: An indifference curve shows the various consumption
Q14: When increasing amounts of a variable factor