Multiple Choice
The figure given below shows the production possibility curves for Canada (AB) and the Rest of the World (CD) . The opportunity cost of producing a bushel of corn in Canada and in the Rest of the World are _____ liters and _____ liters of maple syrup respectively. 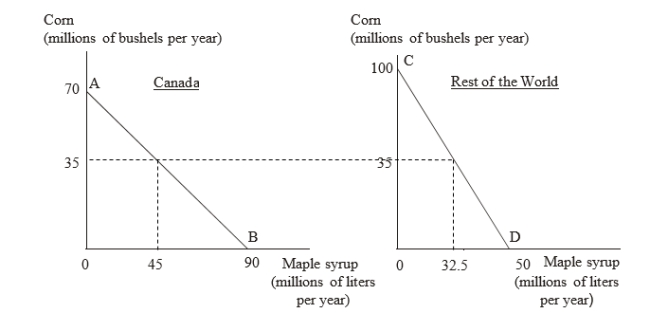
A) 9/7; 2
B) 7/9; 2
C) 9/7; 1/2
D) 7/9; 1/2
Correct Answer:

Verified
Correct Answer:
Verified
Q17: Explain how products produced by high-wage workers
Q18: Consider a two-country, two-commodity model. The
Q19: In a two-country two-commodity model, if a
Q20: Mercantilists believed that a country gains from
Q21: Arbitrage is the act of buying at
Q23: If country X has a higher labor
Q24: Consider a two-country, two-commodity model. The
Q25: Which of the following is NOT true
Q26: The table given below shows the
Q27: If a country exports the good that