Multiple Choice
The figure given below shows the production possibility curves for Canada (AB) and the Rest of the World (CD) . The opportunity cost of producing one liter of maple syrup in Canada and in the Rest of the World are _____ bushels and _____ bushels of corn respectively. 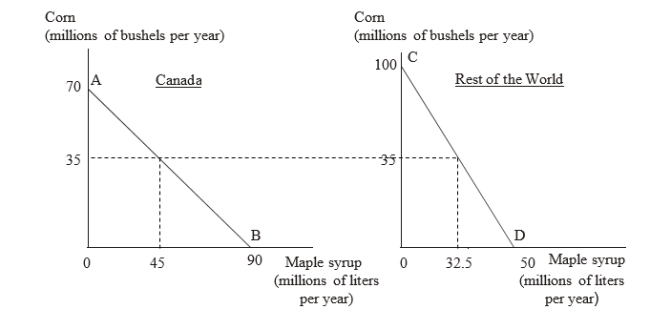
A) 9/7; 2
B) 7/9; 2
C) 9/7; 1/2
D) 7/9; 1/2
Correct Answer:

Verified
Correct Answer:
Verified
Q44: In a two-country two-good model, if a
Q45: The table given below shows the
Q46: The table given below shows the
Q47: When Adam Smith presented his theory of
Q48: Consider a two-country, two-commodity model. The
Q50: The table given below shows the
Q51: The production-possibility curve shows various bundles of
Q52: Straight-line production-possibility curves indicate that the opportunity
Q53: According to the theory of comparative advantage,
Q54: Consider a two-country, two-commodity model. The