Multiple Choice
The figure given below shows the production possibility curves for Canada (AB) and the Rest of the World (CD) . Suppose Canada begins to trade with the Rest of the World. If in the international market 1 bushel of corn is exchanged for 1 liter of maple syrup, Canada will produce _____ bushels of corn and the Rest of the World will produce _____ liters of maple syrup. 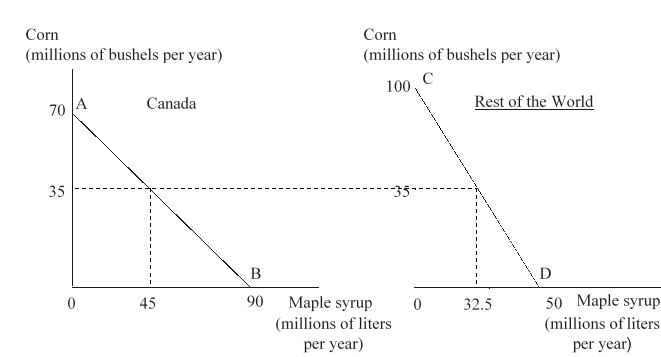
A) 35; 32.5
B) 70; 50
C) 0; 0
D) 90; 100
Correct Answer:

Verified
Correct Answer:
Verified
Q37: Consider a two-country, two-commodity model. The
Q38: The table given below shows the
Q39: The table given below shows the
Q40: If a country does not have an
Q41: According to the Mercantilists, governments should:<br>A)subsidize and
Q43: If country X has higher labor productivity
Q44: In a two-country two-good model, if a
Q45: The table given below shows the
Q46: The table given below shows the
Q47: When Adam Smith presented his theory of